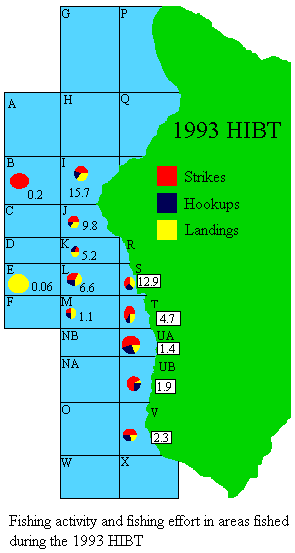
Figure 6A

Thus for example if we look at the data for the whole of the 1993 tournament
we can see that in area K (kilo) there were 4 strikes, 7 hookups and 10
landings with an average of 5.2 boats in K during any one hour. This
resulted in about a 1 in 11 (11.9%) chance of fish contact per boat.hour in
K. Of the 14 areas fished in 1993, K was the sixth best in terms of activity
per boat.hour. It is clear that over the 1993 Tournament UA and UB were the
most productive and areas B C and E the least productive. In 1994 areas
H, L and UA and UB were the most productive.
Return to 1993/94 Tournaments
